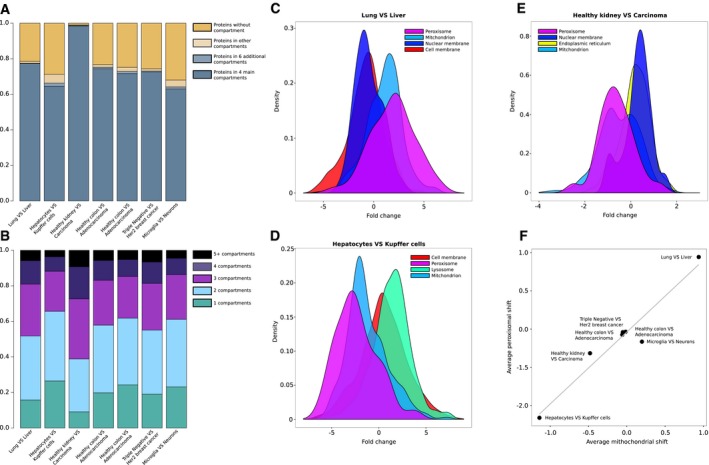
Figure EV1. Protein annotation and compartment fold change distribution for different proteomics datasets.

-
AProtein annotation in Gene Ontology (cellular component terms) for the seven datasets analyzed. Percentage of protein with (i) no GO annotation, (ii) any GO cellular component annotation, (iii) annotation to ten major cellular compartments (nucleus, cytoplasm, mitochondrion, extracellular space, endoplasmic reticulum, Golgi apparatus, cell membrane, nuclear membrane, lysosome, and peroxisome), and (iv) annotation to four major cellular compartments (nucleus, cytoplasm, mitochondrion, and extracellular space) are reported for each dataset.
- B
-
C–EDensity plot for the top four significant compartments (Mann–Whitney test P < 0.05) depicting the average fold change distributions for (C) lung vs. liver cells (Geiger et al, 2013), (D) hepatocytes vs. Kupffer cells (Azimifar et al, 2014), and (E) healthy kidney vs. renal carcinoma cells (Guo et al, 2015).
-
FScatter plot of average abundance shift of mitochondrial proteins (x‐axis) and peroxisomal proteins (y‐axis) in seven different datasets (Geiger et al, 2012; Wiśniewski et al, 2012; Azimifar et al, 2014; Guo et al, 2015; Sharma et al, 2015; Wisńiewski et al, 2015; Tyanova et al, 2016); a gray line represents the line fitted using the resulting points (Pearson's R = 0.97, P = 3.5 × 10⁻⁴). Proteins shared between the two compartments (annotated as both mitochondrial and peroxisomal) were excluded for this analysis.
