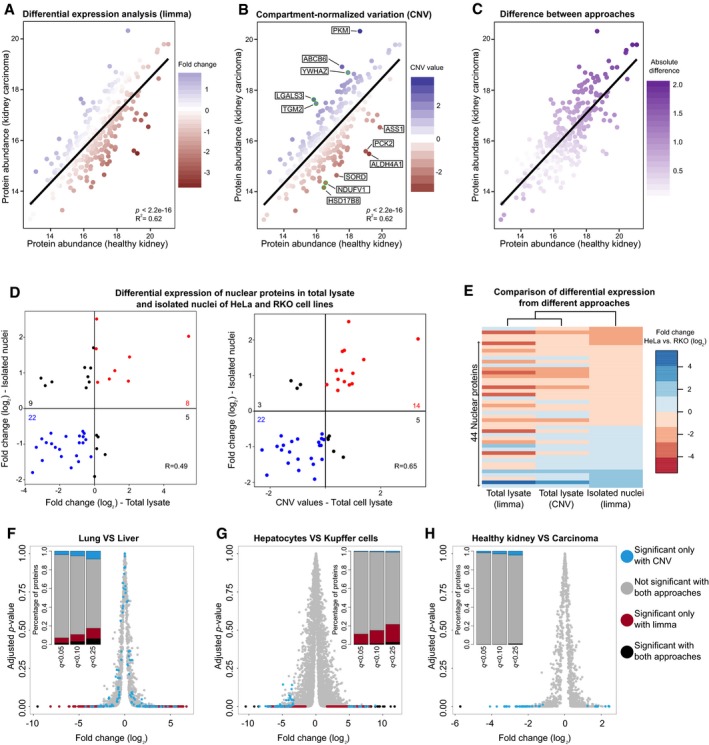
Figure 2. Compartment‐specific analysis reveals differences in organelle composition that can be validated by sub‐cellular fractionation.

-
A–CMitochondrial proteins are plotted using their absolute abundance (IBAQ score) in healthy kidney vs. renal carcinoma cells (Guo et al, 2015). Each mitochondrial protein is colored according to (A) its fold change calculated by standard differential expression using the limma package (Ritchie et al, 2015; Phipson et al, 2016); (B) its CNV value (five proteins with the highest CNV value and five proteins with the lowest CNV values are highlighted and annotated in boxes); and (C) the absolute difference between the two values.
-
D>Correlation between standard fold change values (left panel) and CNV values (right panel) of proteins quantified in the total lysate and isolated nuclei of HeLa and RKO cells. Only proteins that are differentially regulated (adj. P < 0.05) in isolated nuclei are shown.
-
EClustering of nuclear protein fold changes estimated from whole cells and isolated nuclei, and comparison to the CNV values obtained from whole cell data.
-
F–HComparison of standard differential expression and CNV approach for the three datasets shown in Fig 1B–D. Volcano plots based on fold changes and adjusted P‐values (limma) obtained for (F) lung vs. liver cells (Geiger et al, 2013), (G) hepatocytes vs. Kupffer cells (Azimifar et al, 2014), and (H) healthy kidney vs. renal carcinoma cells (Guo et al, 2015). Proteins are colored depending on their significance when using the standard limma approach and the CNV approach (based on the four main compartments, q‐value < 0.1). A stacked barplot (inset) shows the percentage of unique proteins belonging to each category for three q‐value thresholds (0.05, 0.1, and 0.25).
