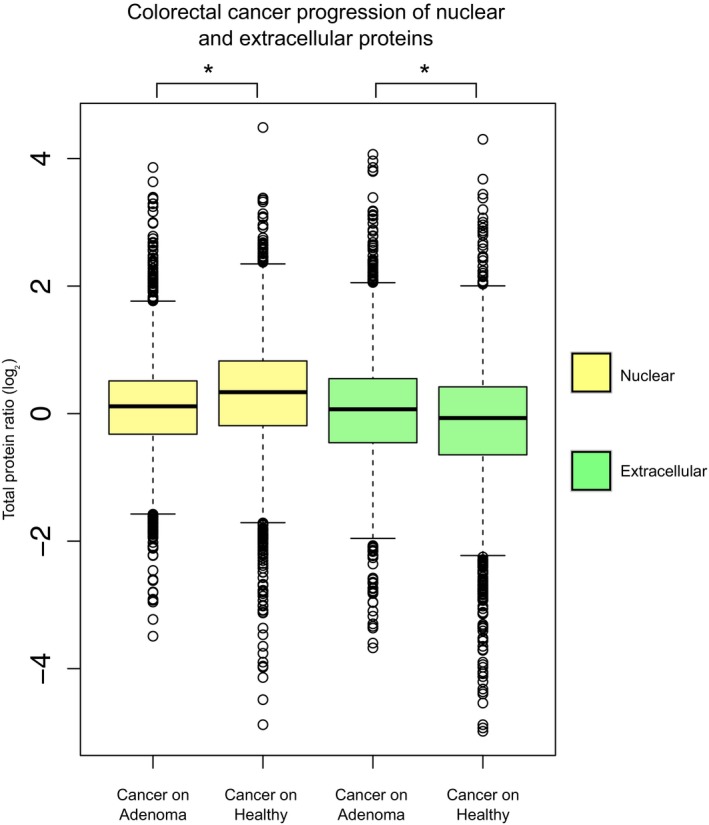
Figure EV2. Collective shifts of abundance for nuclear and extracellular proteins in colorectal cancer.

Cellular compartment shifts during colorectal cancer progression: cancer/healthy protein ratios are compared to cancer/adenoma protein ratios for 3,231 and 3,206 nuclear proteins, respectively (Mann–Whitney test *P < 0.01), and for 2,172 and 2,155 extracellular proteins, respectively (Mann–Whitney test *P < 0.01; Wisńiewski et al, 2015). The average ratio of the protein abundances between two conditions is represented by boxplots; significant comparisons are marked with stars. Related to Fig 1. Boxplots: the horizontal line represents the median of the distribution, the upper and lower limit of the box indicate the first and third quartile, respectively, and whiskers extend 1.5 times the interquartile range from the limits of the box. Values outside this range are indicated as outliers points.
