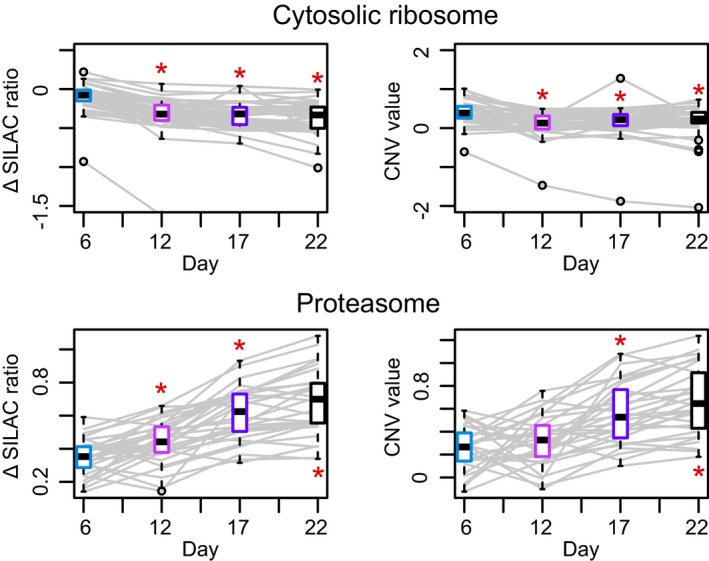
Figure EV5. Complex subunit variation during Caenorhabditis elegans aging.

Abundance variation of complex members of the cytosolic ribosome and proteasome during Caenorhabditis elegans aging. For every complex, the abundance variation of each member over the five age groups is reported using the Δ SILAC ratio (difference between the experimental SILAC ratio of a given time point and the SILAC ratio at day 1, left) and the CNV value (right). Each age group has a boxplot (colored as the corresponding time point in the panels A–C of Fig 3) representing the variance between the abundances of the complex members at that given age. Significant changes are marked with a red asterisk (Mann–Whitney test *P < 0.05). Related to Fig 3 and Dataset EV6. Boxplots: the horizontal line represents the median of the distribution, the upper and lower limit of the box indicate the first and third quartile, respectively, and whiskers extend 1.5 times the interquartile range from the limits of the box. Values outside this range are indicated as outliers points.
