
Figure 4.
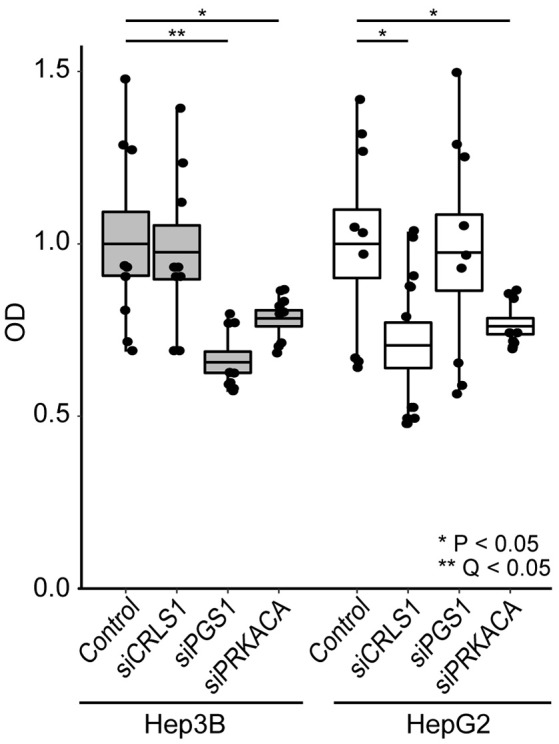
siRNA inhibition of CRLS1, PGS1, and PRKACA expression in Hep3B and HepG2 liver cell lines leads to decreased growth after 24 h in comparison with controls. Comparisons performed using Welch's T-test. See methods for details.
Official websites use .gov
A
.gov website belongs to an official
government organization in the United States.
Secure .gov websites use HTTPS
A lock (
) or https:// means you've safely
connected to the .gov website. Share sensitive
information only on official, secure websites.
siRNA inhibition of CRLS1, PGS1, and PRKACA expression in Hep3B and HepG2 liver cell lines leads to decreased growth after 24 h in comparison with controls. Comparisons performed using Welch's T-test. See methods for details.