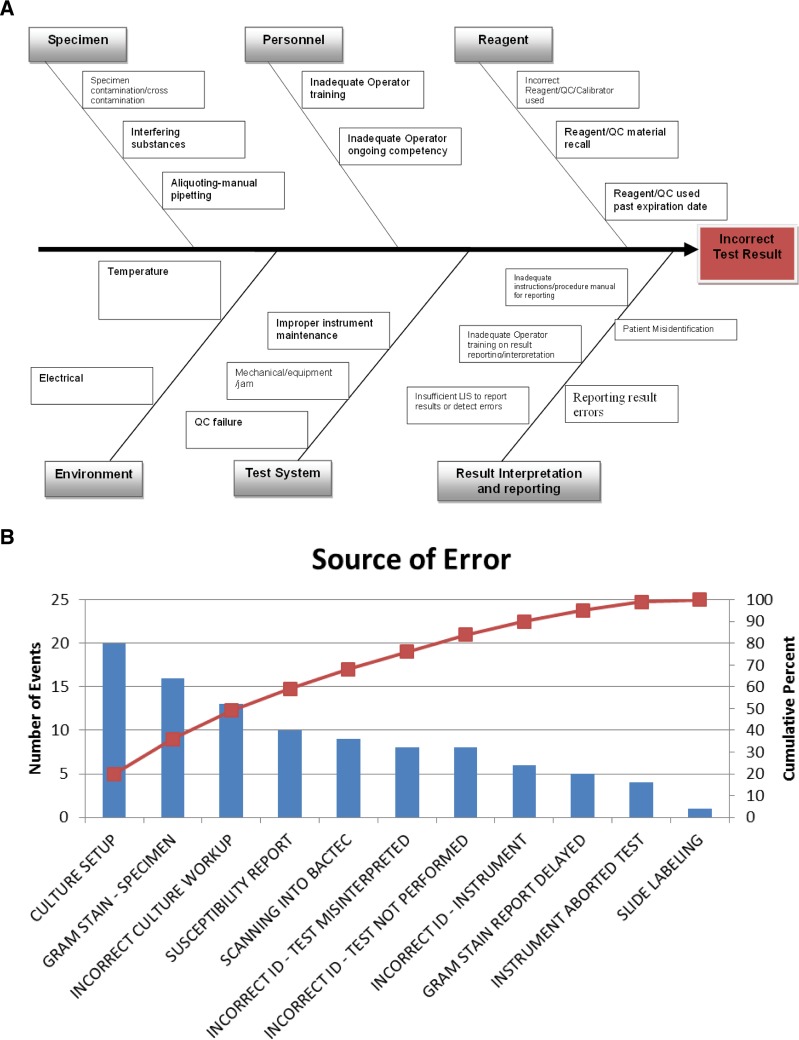
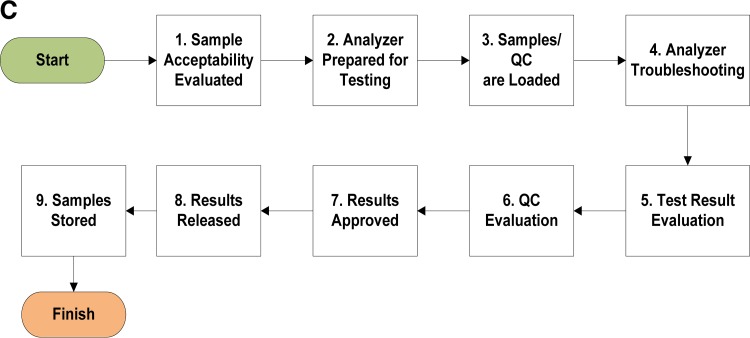
FIG 14.
Three examples of root-cause analysis tools, including a fishbone diagram to identify sources of an analytical error (A), a Pareto chart to identify sources of error where improvement will have the highest impact (B), and a process map to identify variation in the steps to complete a process (C). Root-cause analysis tools are used to investigate and uncover the true reason (the “root cause”) that errors occurred.


