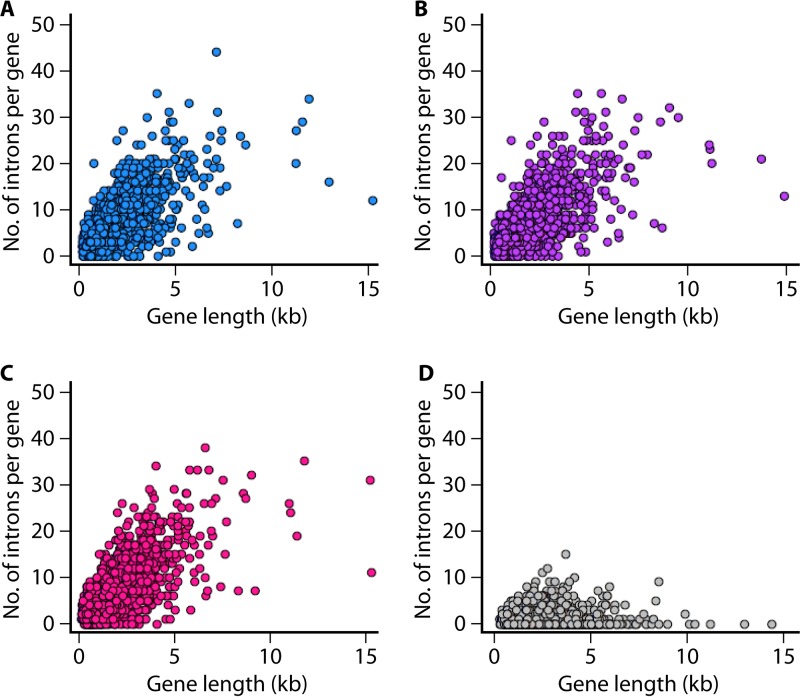
FIG 6.
High intron densities in Pneumocystis genomes. The graphs show numbers of introns per gene as a function of gene length (measured in kilobases) for three Pneumocystis species as well as for the fission yeast Schizosaccharomyces pombe. Each dot represents a single gene. Intron densities per gene for 1,624 orthologous genes are systematically higher for Pneumocystis spp. than those for S. pombe. Intron positions and sizes were extracted from annotated GenBank files for P. jirovecii (accession no. GCA_001477535.1) in panel A, P. carinii (accession no. GCA_001477545.1) in panel B, P. murina (accession no. GCF_000349005.1) in panel C, and S. pombe (accession no. GCF_000002945.1) in panel D.

