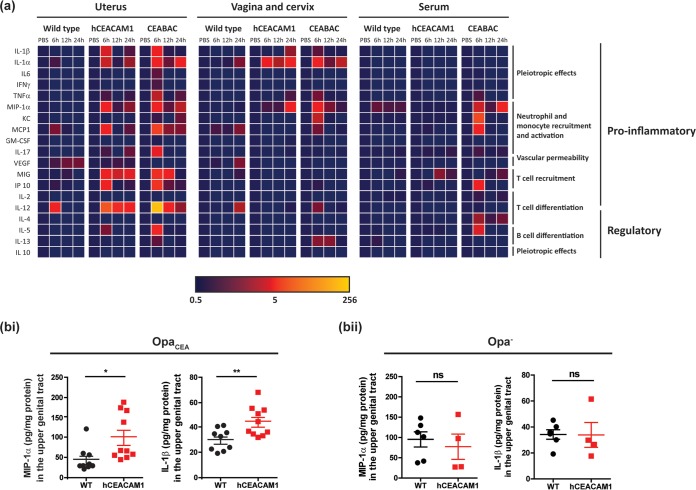
FIG 6.
Cytokine response during upper genital tract infections of wild-type and CEACAM-expressing mice. (a) Cytokine levels within homogenized tissues and serum, as determined by Luminex multiplex assays after transcervical infection of β-estradiol-treated mice with 107 OpaCEA-expressing N. gonorrhoeae bacteria for 6 h, 12 h, and 24 h. The heat map depicts the fold change normalized to the value for uninfected PBS-treated controls. Data are for 3 mice of each genotype per time point for infected groups and 2 to 3 mice per genotype for uninfected PBS-treated controls. The heat map was generated in Microsoft Excel software. GM-CSF, granulocyte-macrophage colony-stimulating factor; VEGF, vascular endothelial growth factor. The other abbreviations are defined in the text. (b) MIP-1α and IL-1β levels in the upper genital tract of β-estradiol-treated mice at 24 h postinfection with OpaCEA (bi) and Opa− (bii) N. gonorrhoeae. Horizontal bars represent means; error bars represent standard errors. P values were determined by a t test. **, P < 0.01; *, P < 0.05; ns, not significant. For panel bi, data points from two independent experiments were pooled and data are for 9 or 10 mice per genotype. For panel bii, data are for 4 or 5 mice per genotype. Statistical analysis was performed using GraphPad Prism (version 5.04) software.

