FIG 4.
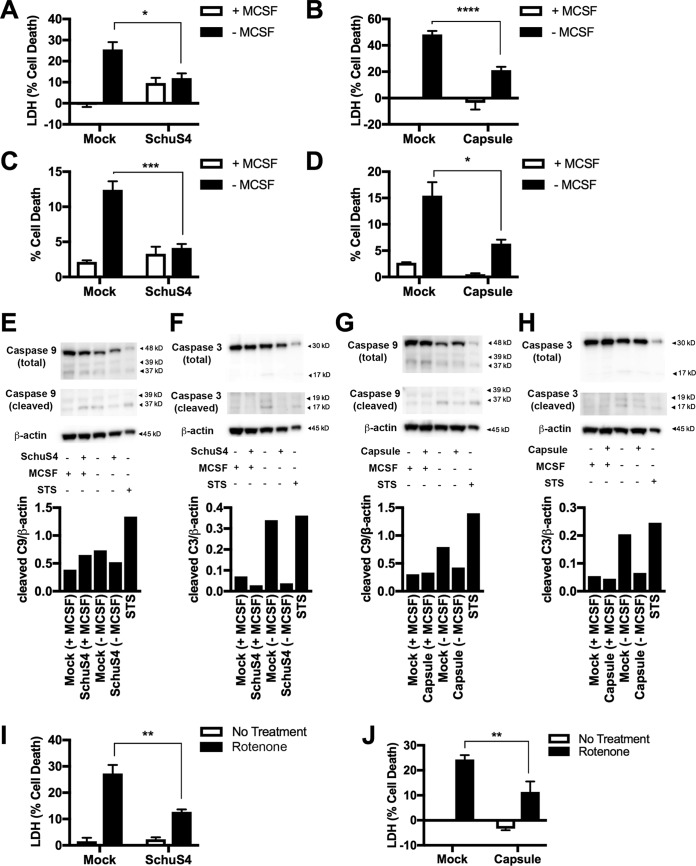
SchuS4 and capsule impair apoptotic cell death. (A) Cytotoxicity, as determined by extracellular LDH activity, in BMM infected with SchuS4 (MOI, 5) and then starved of M-CSF (48 h). (B) Cytotoxicity, as determined by extracellular LDH activity, in BMM exposed to capsule (10 μg/ml) and then starved of M-CSF (48 h). (C) Percent cell death, as determined by the percentage of NucGreen-positive cells, in BMM infected with SchuS4 (MOI, 5) and then starved of M-CSF (48 h) (D) Percent cell death, as determined by the percentage of NucGreen-positive cells, in BMM exposed to capsule (10 μg/ml) and then starved of M-CSF (48 h). (E) Western blots and the corresponding densitometry analysis results showing cleaved and total caspase-9 (C9) levels in BMM infected with SchuS4 (MOI, 5) and then starved of M-CSF (48 h). Staurosporine treatment (1 μM) of BMM for 9 h was used as the positive control. (F) Western blots and the corresponding densitometry analysis results showing cleaved and total caspase-3 (C3) levels in BMM infected with SchuS4 (MOI, 5) and then starved of M-CSF (48 h). Staurosporine treatment (1 μM) of BMM for 9 h was used as the positive control. (G) Western blots and the corresponding densitometry analysis showing cleaved and total caspase-9 levels in BMM exposed to capsule (10 μg/ml) and then starved of M-CSF (48 h). Staurosporine treatment (1 μM) of BMM for 9 h was used as the positive control. (H) Western blots and the corresponding densitometry analysis showing cleaved and total caspase-3 levels in BMM exposed to capsule (10 μg/ml) and then starved of M-CSF (48 h). Staurosporine treatment (1 μM) of BMM for 9 h was used as the positive control. (I) Extracellular LDH levels in BMM culture supernatants at 24 h following infection with SchuS4 (MOI, 10) and exposure to rotenone (8 μM). (J) Extracellular LDH levels in BMM culture supernatants at 24 h following exposure to capsule (10 μg/ml) and rotenone (8 μM). Western blot images and densitometry results are representative of those from 3 separate experiments. Otherwise, data are presented as the mean ± SEM (3 technical replicates) from one representative experiment that was repeated 3 times with similar results. P values were determined using two-way ANOVA. *, P < 0.05; **, P < 0.01; ***, P < 0.001; ****, P < 0.0001.

