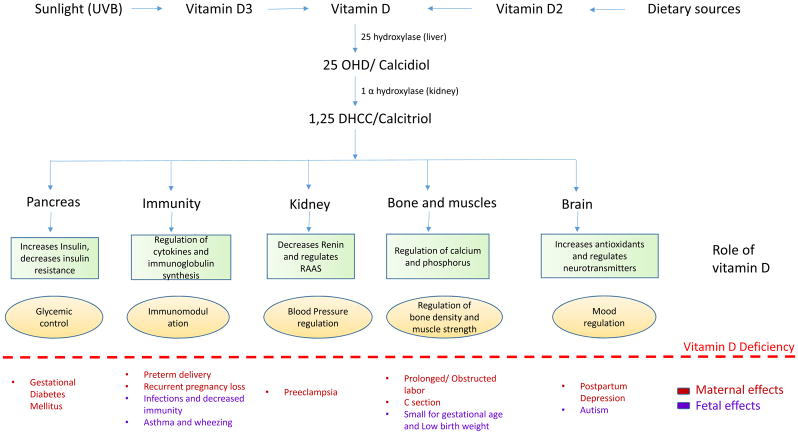
Figure 2.
The sxhematic diagram depicts the activation of vitamin D by two hyroxylation steps, one each in liver and kidney, followed by the normal physiological role of vitamin D in each organ. The specific maternal and fetal repercussion of vitamin D deficiency are mentioned below the dotted line.

