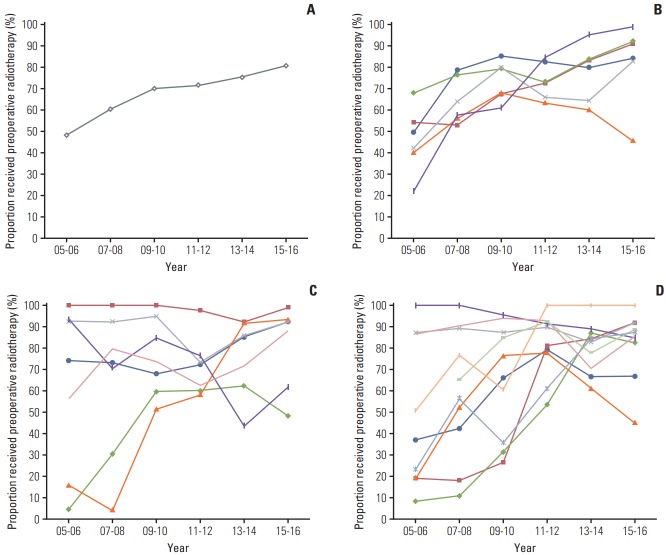
Fig. 1.
Proportion of rectal cancer patients who received preoperative radiotherapy (RT) by year of diagnosis. (A) National average. (B) Six institutions > 1,000 cases/12 years. (C) Seven institutions with 300-499 cases/12 years. (D) Ten institutions with 200-300 cases/12 years. Vertical axis indicates the number of preoperative RT divided by the number of preoperative and postoperative RT and horizontal axis indicates year of diagnosis.

