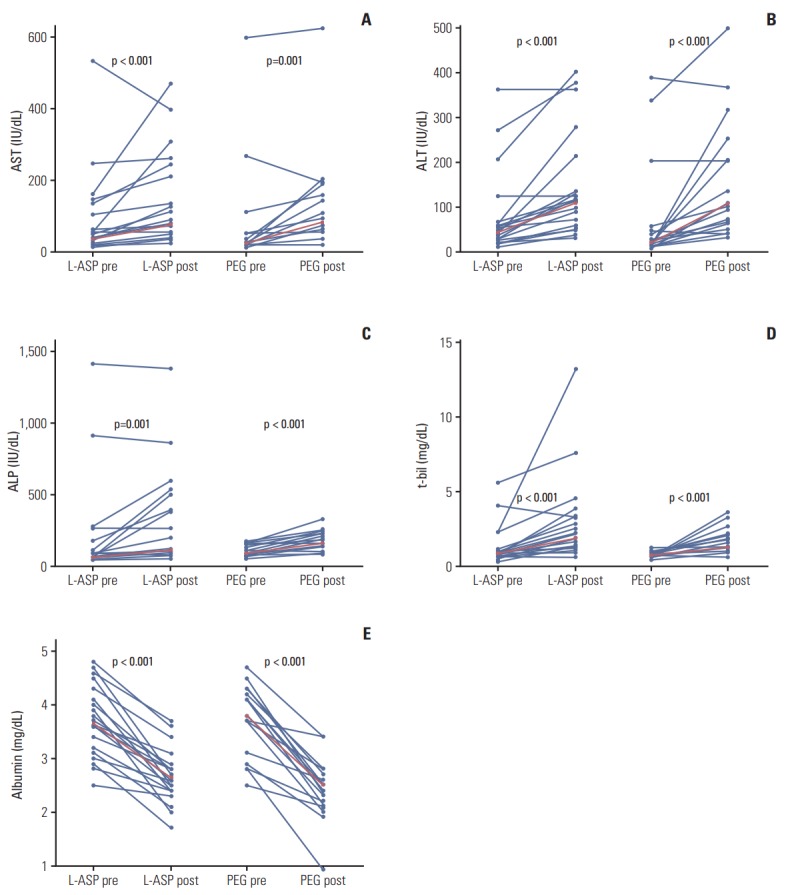
Fig. 1.

Comparison of liver function tests between before chemotherapy (pre) and maximum values after chemotherapy (post). Each dot represents pre and post aspartate aminotransferase (AST) (A), alanine aminotransferase (ALT) (B), alkaline phosphatase (ALP) (C), total bilirubin (t-bil) (D), and albumin (E) levels. The red line represents the change in median pre and post values. Pre and post values were compared within each group using the Wilcoxon signed rank test. L-ASP, L-asparaginase; PEG, pegylated.
