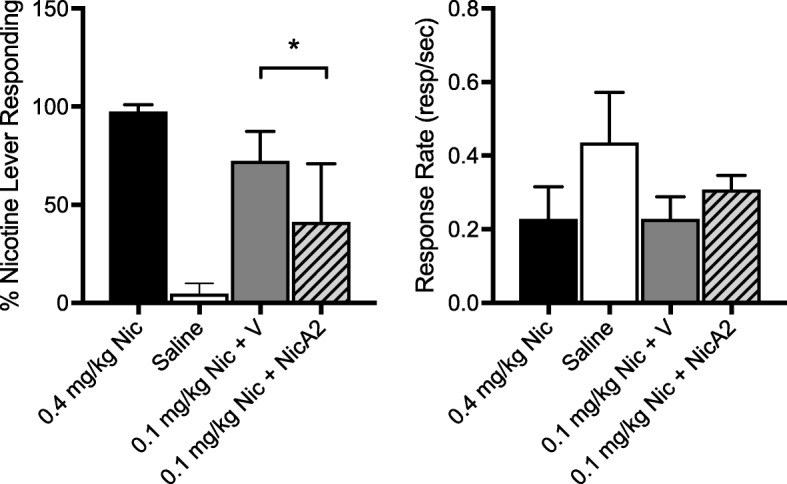
Fig. 8.

Effect of NicA2 on nicotine discrimination. Each bar represents mean (± SD) percent responding on the nicotine lever (left panel) or overall response rate (right panel) following administration of saline, the training dose (0.4 mg/kg), or the substitution dose (0.1 mg/kg) after PBS vehicle (V) or NicA2 pretreatment. * p < 0.05, paired t test (n = 4)
