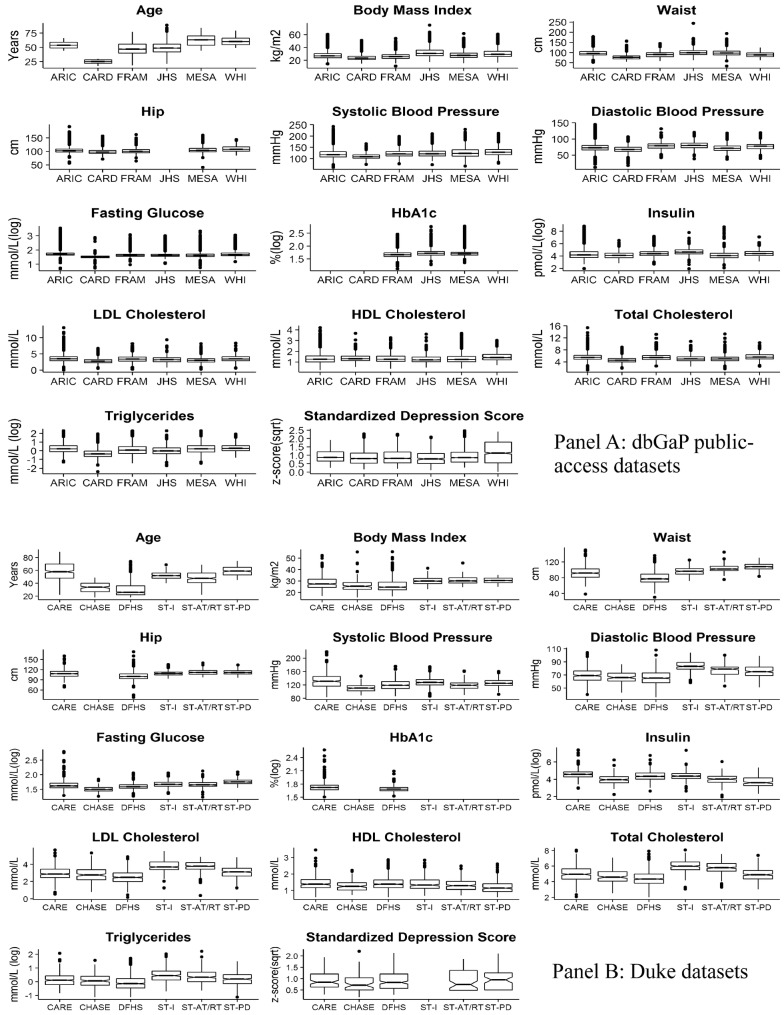
Fig. 2.
a Distributions of harmonized phenotypes in dbGaP public-access datasets. Each notched box plot shows the distribution (i.e., five point summary statistics, outliers, and notches based on the median ± 1.58 * IQR/sqrt(n)) of one variable in the six dbGaP studies, i.e., ARIC, CARDIA, FRAMINGHAM, JACKSON HEART, MESA, and WHI; and b six Duke studies, i.e., CAREGIVER, CHASE, DFHS, STRRIDE-1, STRRIDE-AT/RT, and STRRIDE-PD. The scales for fasting glucose, insulin, HbA1C, and triglyceride were log transformed, and the standardized depression measure was square root transformed

