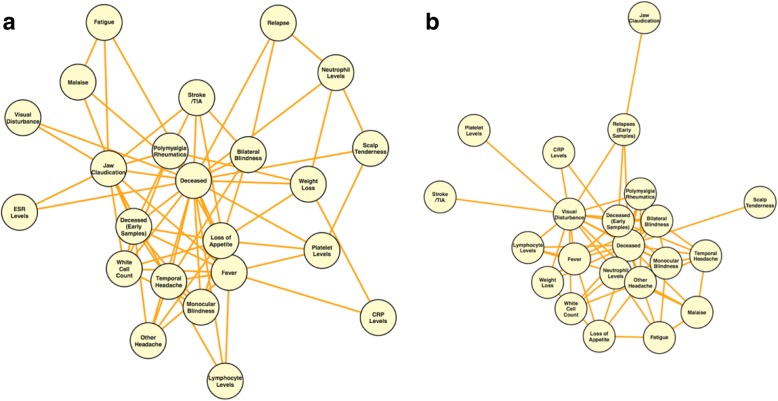
Fig. 5.
Network analysis of clinically correlated phenotypes with shared genes. Network plots show the clinical phenotypes observed for GCA patients at the time of presentation with shared, statistically significant genes (FDR < 0.01) in (a) CD4 and (b) CD8 samples. Each network node represents a phenotype that shares significant genes with > 1 other phenotype. Network edges represent connections (shared genes) between phenotypes

