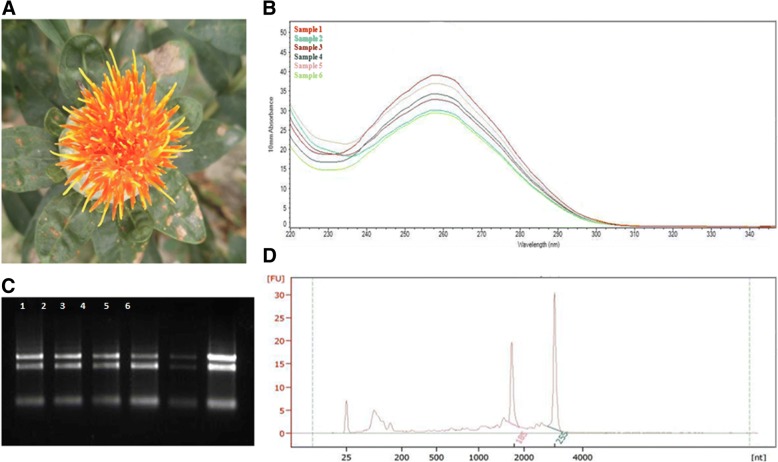
Fig. 1.
Extraction and validation of high quality RNA. a The safflower at third day after anthesis (DAA). b Nanodrop map of the RNA. Sample 1 to 6 represent the RNA of different tissues (roots, stems, leaves, and petals 1, 3 and 5 DAA). c RNA gel electrophoresis. 1–6 represent the RNA of different tissues (roots, stems, leaves, and petals 1, 3 and 5 DAA). D: RNA integrity detected by agilent 2100. The 18 s and 28 s was marked in the figure

