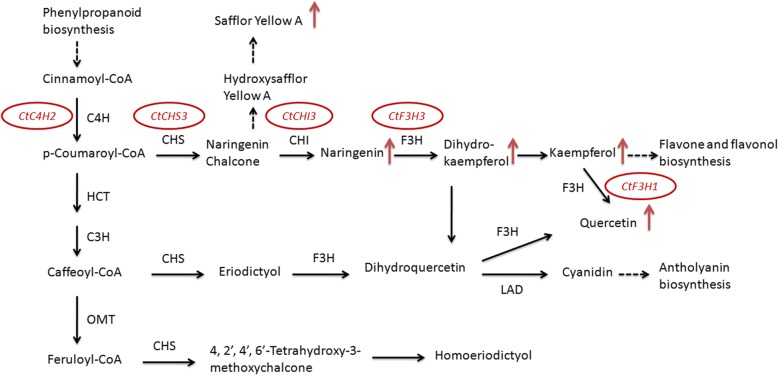
Fig. 6.
Flavonoid metabolic pathway in safflower and the genes significantly respond to MeJA treatment. The diagram was drawn conbined with the chemical composition and gene expression (including the tissue expression and the expression under MeJA treatment). Red arrow represents MeJA induces the content of this flavonoid. The genes inside the red circle were that significantly respond to MeJA treatment based on the gene expression analyses

