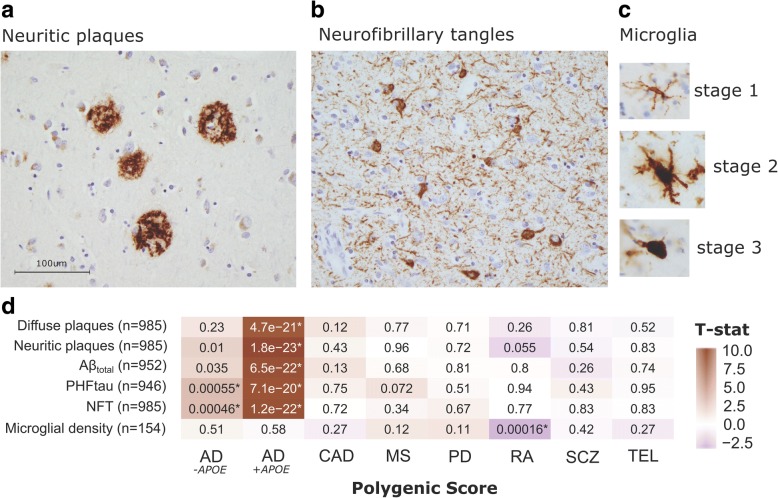
Fig. 2.
Analysis of GRS vs. aggregate AD-related pathologies and microglial density. Immunohistochemistry images showing (a) neuritic amyloid plaques (stained with 4G8), (b) neurofibrillary (tau) tangles (stained with AT8), and (c) microglia at three stages of activation (stained with CR3–43) in our postmortem tissue samples. (d) Two-sided uncorrected P-values derived from robust regression are shown within tiles. Models co-varied for age at death, sex, and three EIGENSTRAT principal components. The color scale indicates magnitude and direction of the effect T-statistic. *significant after FDR correction (PFDR < 0.05)

