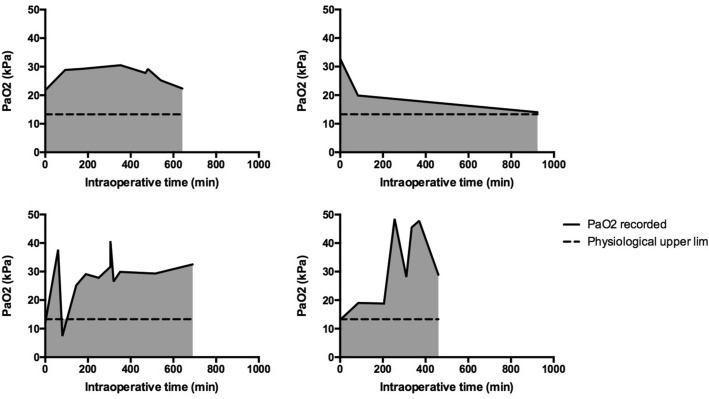
Fig. 2.
Sample traces demonstrating of cumulative oxygen dose for four individual patients. The solid line represents the actual PaO2 recorded in successive blood gases, whilst the dashed line represents the physiological upper limit (13.3 kPa). Area under the curve (shaded) was calculated between the times of the first and final ABGs

