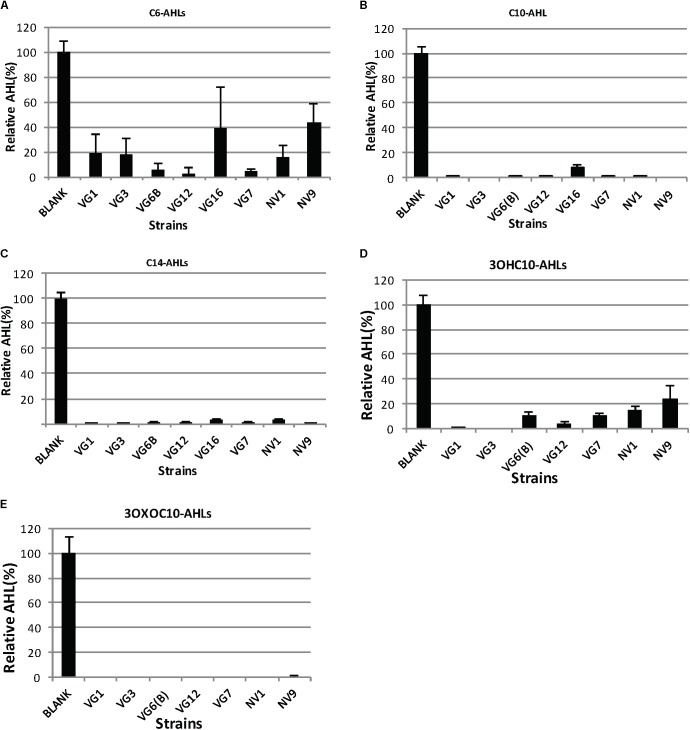
FIGURE 1.
Degradation of AHLs by the isolated bacteria. The amount of AHLs degraded by different isolates is listed, relative to the negative control. Quantification of AHLs was performed as described in Section “Materials and Methods.” Briefly, AHLs were extracted with ethyl acetate, which was evaporated under a flux of nitrogen gas. The extracted AHLs were re-suspended in acetonitrile and quantified by HPLC-MS. Cell-free PBS was used as the negative control (100%). Values are the mean of three replicates; error bars represent standard deviation. Charts (A–E) illustrates the degradation of C6, C10, C14, 3OXOC10-AHLs, and 3OHC10-AHLs, respectively.

