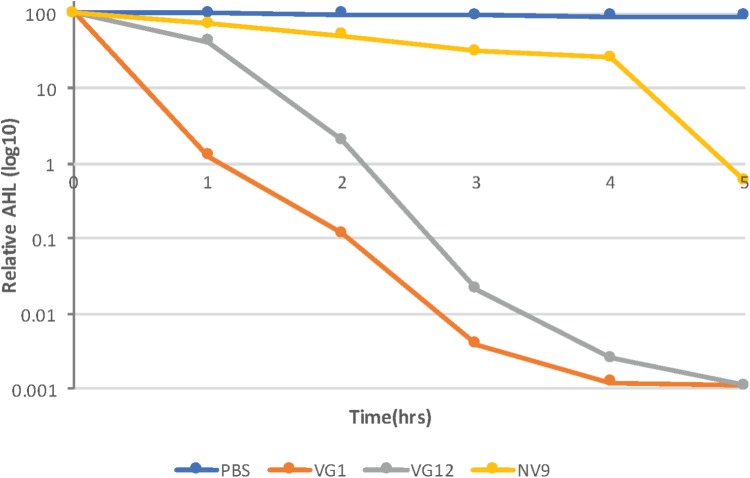
FIGURE 3.
Time-course experiment to study AHL degradation. Log10 of the relative amount of AHLs quantified at each time point is given along the y-axis. AHLs were quantified using HPLC–MS, as described in Section “Materials and Methods.” The amount of AHLs at 0 h is considered 100%. Control (PBS) sample and different strains are represented by different colors, as indicated in the legend. Standard deviation at each time point was <10%.

