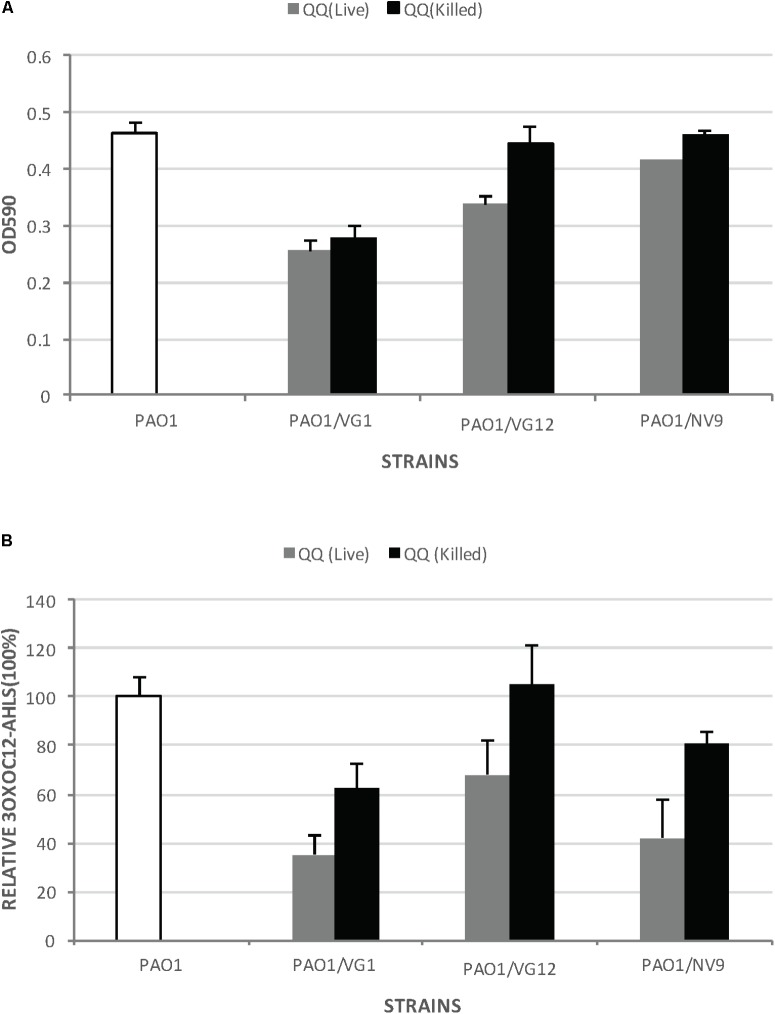
FIGURE 4.
Biofilm formation by Pseudomonas aeruginosa PAO1 incubated with live and dead QQ strains. (A) This experiment was performed in microtiter plates with membrane inserts for wells, as described in Section “Materials and Methods.” The y-axis indicates the OD590 of the crystal violet bound to the wells. White bars represent biofilm formation by PAO1 without any live or dead QQ bacteria. Gray bars represent biofilm formation by PAO1 incubated with live QQ cells, while black bars represent biofilm formation by PAO1 incubated with dead QQ bacteria. LB broth was used as the negative control. Error bars represent the standard deviation for the three replicates. Student’s t-test was applied to determine significance; p-values: VG1 (0.29), VG12 (0.04), and NV9 (0.09). (B) Relative amount of 3OXOC12-AHLs in the supernatant of PAO1 incubated with live or dead QQ bacteria. The amount of AHLs in the supernatant of PAO1 incubated with live QQ bacteria is shown as gray bars, while that detected in the presence of dead QQ bacteria is shown as black bars. The amount of AHLs produced by PAO1 (without live/dead QQ bacteria) is shown by white bars (100%). Error bars represent the standard deviation. Student’s t-test showed no significant difference in the amount of 3OXOC12-AHLs in the PAO1 supernatant incubated with live/dead VG1 (p-value = 0.16), VG12 (p-value = 0.219), and NV9 (p-value = 0.22).

