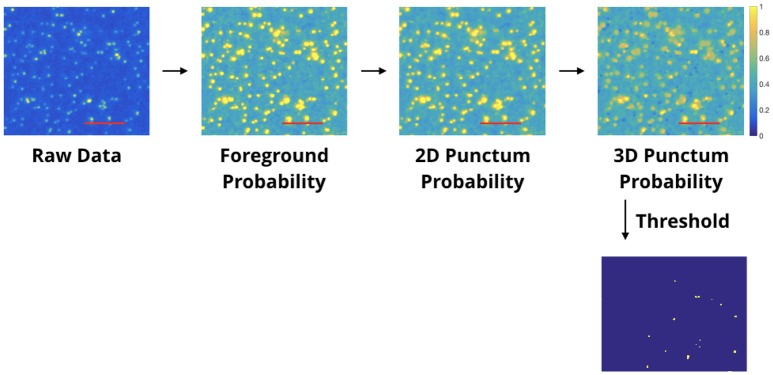
Figure 4.
Automated punctum detection pipeline. This example illustrates the pipeline for antibody characterization. Each processed image shows the blobs/regions which have met criteria for being a punctum, and each successive panel adds a new requirement; the number of blobs considered as puncta decreases accordingly. In the final thresholded image, the blobs shown have met the requirement of spanning 3 slices and are centered on the slice shown. Other blobs which may appear “missing” are centered either on the slice before or after. The first box shows raw single-label immunofluorescence from a single slice. The second box is the output of a “foreground probability” step; the intensity value of each pixel encodes the probability it belongs to the foreground. The third box is the output of a “2D Punctum Probability” step (each pixel coding the probability that it belongs to a 2D blob). Pixels in the 4th box display the probability that a voxel belongs to a blob which spans a minimum number of slices. The final thresholded image is shown below. The threshold is established by visual observation; for this work, the threshold was set to 0.9 for the entire project. Red scale bars represent 5 μm.

