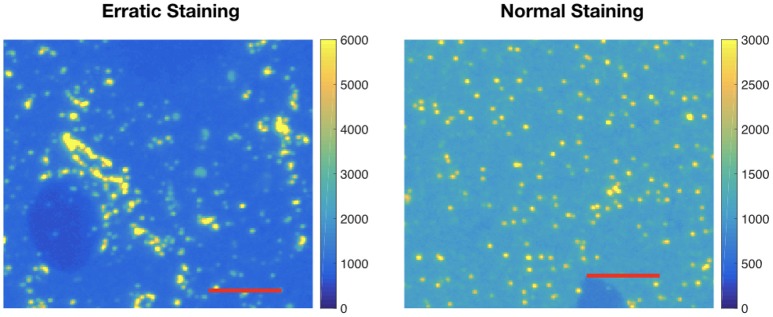
Figure 5.
Example of erratic labeling. Left: Immunolabeling for collybistin (associated with GABAergic synapses) on a raw IF slice; note the very broad distribution of sizes for puncta. Clusters of immunofluorescent label are detected as one large punctum; for antibodies that give such labeling pattern, the average punctum size will be large and with a large size variance. Right: Relatively “normal” pattern of immunolabeling on a raw IF slice, using a different collybistin candidate antibody. This difference is automatically quantified by computing the average three dimensional punctum size and size variance. The image on the left has an average punctum size of 124 pixels and standard deviation of 1,350. The image of the right has an average punctum size of 10 pixels and standard deviation of 89 pixels. Each red scale bar is 5 μm.

