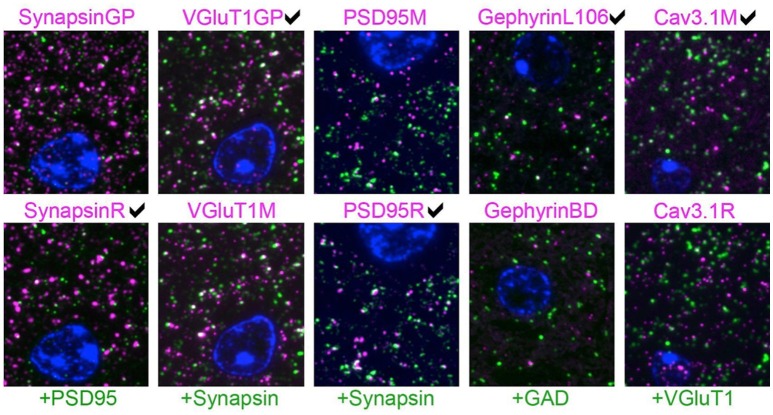
Figure 6.
Pairwise comparison of immunofluorescence on single sections from mouse brain. Each column represents an experiment where two antibodies against the same target protein (magenta) were evaluated by double labeling with a reference antibody (green). The expert's visually-based preference is marked for each column. The sections are also labeled with the nuclear stain DAPI (blue). For each experiment, the two images are from the same section, except for the gephyrin results, where immunolabeling with the two gephyrin antibodies was performed on different sections. The SACT measurements for these images are shown in Table 2. Each image is 16 × 18 μm.

