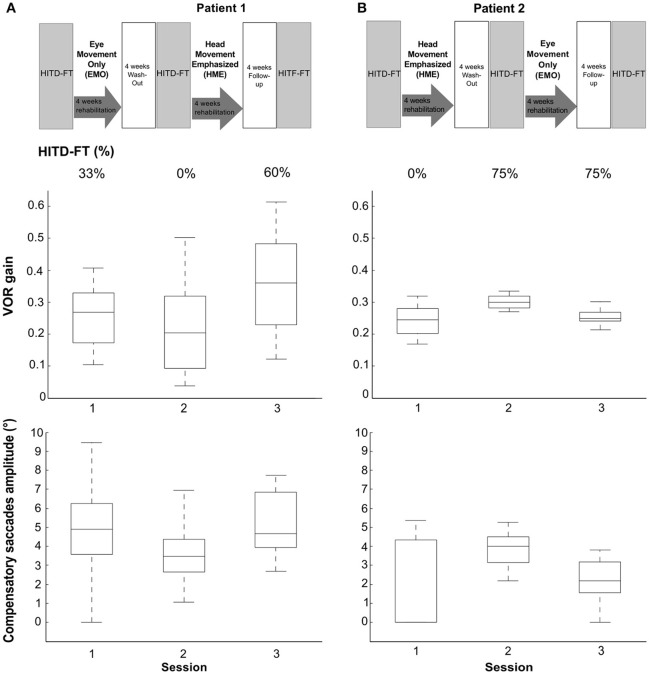
Figure 2.
Rehabilitation effects on head impulse testing device—functional testing (HITD-FT) scores, head impulse gain, and compensatory saccade amplitude. This figure shows HITD-FT scores (top), head impulse gain (middle), and compensatory saccade amplitude (bottom) in the course of the rehabilitation program sketched on top for patients 1 (A) and 2 (B). In a crossover design, patient 1 was first treated with eye-movement-only rehabilitation (EMO), and, after a 4-week washout, with head-movement-emphasized rehabilitation (HME), patient 2 first with HME, then with EMO. During HITD-FT testing, patients were asked to determine the orientation of a Landolt ring on a screen two meters straight ahead while their head was passively moved. HITD-FT score was calculated as the rate (percentage) of correct answers from all trials of one patient in one session. From simultaneous recordings of eye and head movement, vestibulo-ocular reflex (VOR) gain (ratio of median eye and head velocity within a 10 ms window between 55 and 65 ms after head impulse onset) and saccade amplitude (integration of the area under the saccade(s) deviating from VOR slow phase velocity) were calculated. Gain and saccade amplitude are visualized in box plots. On each box, the central mark is the median, the edges of the box are the 25 and 75th percentiles, the whiskers extend to the most extreme datapoints the algorithm considers to be not outliers. Note the marked increase in dynamic vision (HITD-FT score) after HME with a combined enhancement of the VOR gain and compensatory saccade amplitude in this crossover design in both patients. After EMO, dynamic vision decreased (patient 1) or stayed stable (patient 2) while VOR gain and compensatory saccade amplitude deteriorated in both patients.

