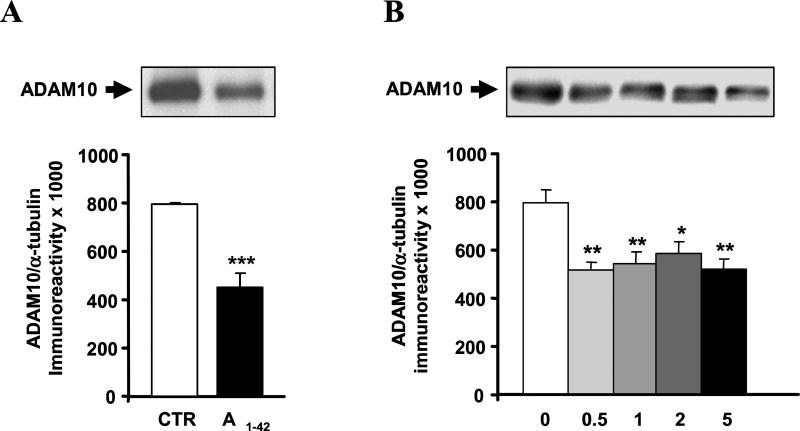
Fig. 4.
(A) Aβ treatment affects ADAM10 protein levels. (Upper) Representative Western blotting of ADAM10 in the cytoskeleton from control and Aβ1–42 treated SH-SY5Yneuroblastoma cells. (Lower) Mean grey levels ratios (mean ± S.E.M.) of ADAM10/α-tubulin immunoreactivities measured by Western blotting in the cytoskeleton from the same samples. ***p < 0.001, Student t-test, n = 6. (B) ADAM10 protein levels are altered in the hippocampus from AD patients. (Upper) Representative Western blot of ADAM10 in the hippocampal cytoskeleton from control (CDR 0) and AD patients with a different progression of the disease (CDR 0.5, CDR 1, CDR 2, CDR 5). (Lower) Mean grey levels ratios (mean ± S.E.M.) of ADAM10/α-tubulin immunoreactivities measured by Western blotting in the hippocampal cytoskeleton from the same samples. *p < 0.05, **p < 0.01, Dunnett’s Multiple Comparison test, n = 13–24.

