
Figure 2.
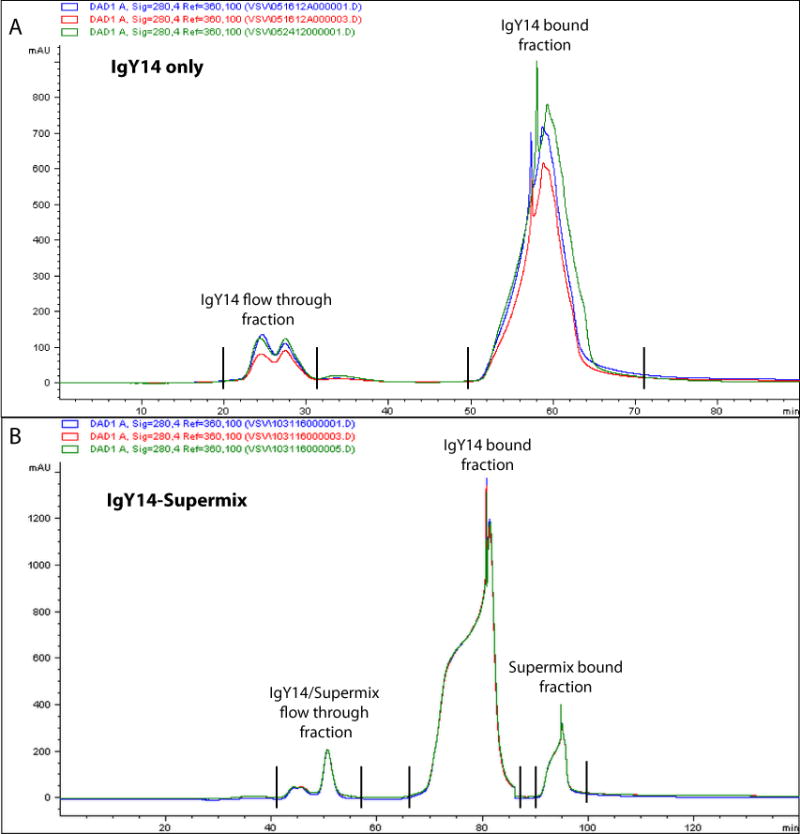
Chromatogram of plasma after immunoaffinity depletion. (a,b) Plasma chromatograms after IgY14-only (a) or tandem IgY14–SuperMix (b) depletion. Overlaid traces showing elution profiles of three reference plasma samples monitored at a 280-nm wavelength over the course of each depletion run. mAU, milli absorbance units.