
Figure 4.
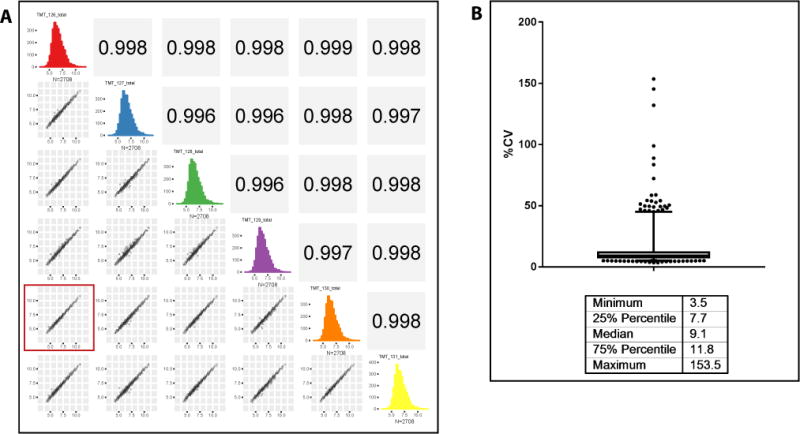
Reproducibility of the plasma processing workflow. Five different aliquots of a pooled plasma sample were depleted using the IgY14–SuperMix tandem depletion strategy and digested. Single 30-μl aliquots of each of the four depletions and two aliquots of the fifth depletion were labeled using TMT6 reagent. After assessing labeling efficiency, the samples were mixed and desalted. The multiplexed sample was fractionated by basic pH reversed-phase chromatography and all 30 fractions were analyzed on a Q Exactive Plus mass spectrometer using in-house packed 75-μm ID picofrit columns packed with 1.9-μm beads to 20-cm length. Data analysis was done using a Spectrum Mill MS Proteomics Workbench. Protein-level total intensity as reported by Spectrum Mill was used for assessing reproducibility. (a) Scatter plots showing correlation of all the replicates. The plot highlighted with the red square is for the two replicates of the same depletion, showing that the correlation is not any different from those for different depletions. (b) Bar and whisker plot of coefficients of variation (CV), showing their median and range.