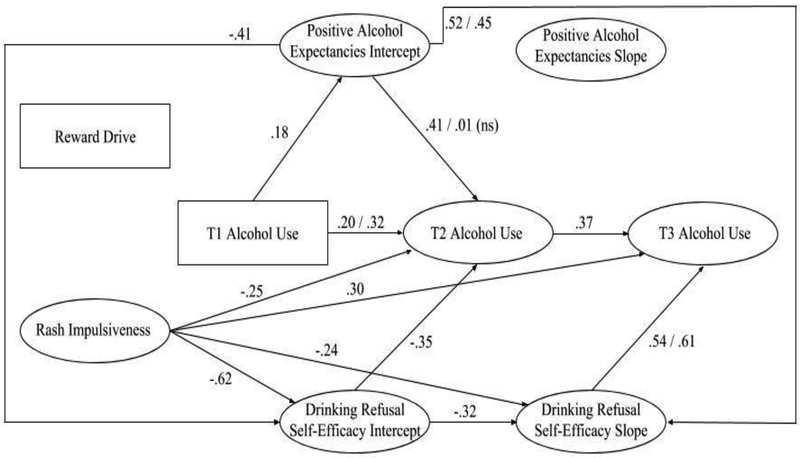
Figure 2.
Structural equation modelling analysis for the younger cohort controlling for Time 1 (T1) alcohol use, family risk, and community risk. Only significant paths are shown, p < .05. Paths with two coefficients are moderated by Time 2 (T2) coping (lower coping/higher coping). Note. DRSE slope is negative.

