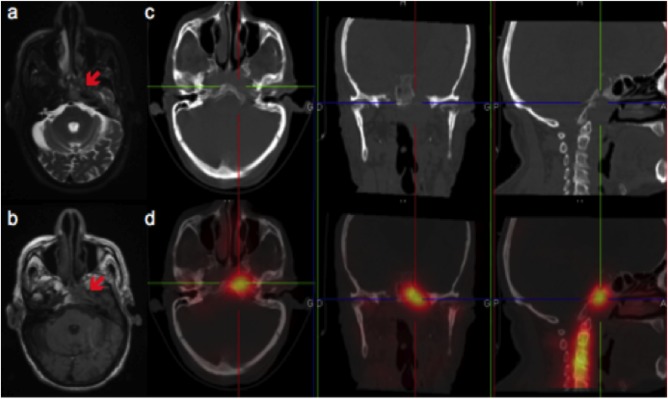
Figure 1.

Typical imaging features of skull base osteomyelitis on MRI and Leukocyte Scintigraphy (SPECT/CT).
MRI: T2 axial weighted‐sequences (A), T1 axial weighted‐sequences (B); LS: axial, coronal, sagittal CT (C), and fused SPECT/CT images (D). MRI shows an hypersignal on the T2 weighted‐sequence and an hyposignal on the T1 weighted‐sequence of the left part of the sphenoid, left part of the clivus and of the petrous part of the left temporal bone, and soft tissue infiltration in the left retropharyngeal and parapharyngeal spaces. CT enables localization of the tracer uptake and shows bony rarefaction of the clivus. SPECT/CT shows high uptake of the radiotracer in the left part of the clivus and in the petrous part of the left temporal bone.
