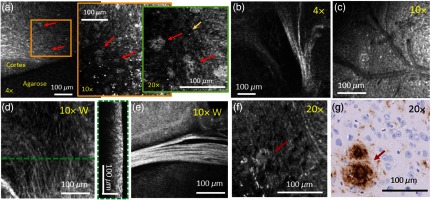
Fig. 4.
Microscopic features of AD and control mouse brain tissue imaged with various magnifications. (a) En-face projections of the same mouse cortex position imaged first with a then with a and last with a objective in a 64-weeks-old mouse brain. (b)–(f) White matter tracts (b), (d)–(e) vascular features (c), and single cellular structures (f) are visible under various magnifications in en-face projections. (c) En-face OCM projection image of a vascular region. (d) En-face projection and the corresponding B-scan OCM image. (e) OCM intensity images taken with a magnification water immersion objective. White matter tracts appear as highly scattering features in the en-face OCM projection image. (g) Histological image showing a similar plaque region as imaged with the magnification objective in (f). For all en-face projections, the intensity values over the first underneath the tissue surface were averaged. In all images, representative plaques are marked with red arrows. Images (b)–(d) were acquired in a 51-week-old mouse brain and for the other images a 64-week-old mouse brain was used.

