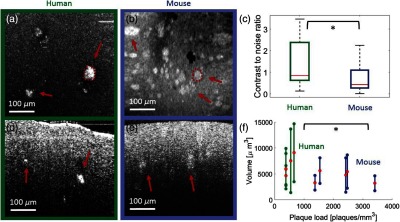
Fig. 6.

Comparison of amyloid-beta () plaques detected by OCM in human and mouse frontal cortex tissue imaged with a magnification objective. En-face projection image in (a) human brain tissue and in (b) mouse brain tissue. In panels (a) and (b), examples of manually segmented plaques are included. (c) Boxplot showing the difference in contrast-to-noise ratio (CNR) measured by OCM within the segmented plaques (). (d) Representative B-scan from AD-affected human brain tissue. (e) Representative B-scan of brain tissue from the AD mouse model. (f) Statistical analysis of the plaque volume over the plaque load in human and mouse brain tissue. The mean values are marked with red dots and the respective standard deviations are indicated by the whiskers for the volume data. The asterisk indicates the significance level . For both en-face projections, the intensity values over the first underneath the tissue surface were averaged.
