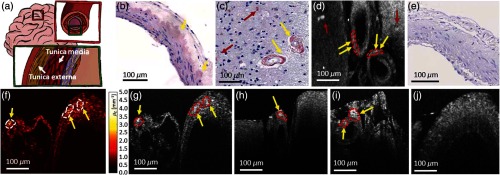
Fig. 7.
OCM of CAA. (a) Schematic drawing of a cerebral artery with the arterial wall structure. White arrows indicate the most frequent positions where accumulates. (b)–(c) Histological images (Congo red and hematoxylin staining). accumulation in the arterial wall structure and plaques can be seen. (d) En-face projection over the first underneath the tissue surface. (e) Histological image (Congo red and hematoxylin staining) of a control cerebral artery, where no accumulations can be found. (f) Attenuation B-scan image. (g) Corresponding intensity B-scan of (f). (h)–(i) Intensity B-scans acquired in CAA-affected brains. (j) OCM B-scan image of the control cerebral artery. Yellow arrows indicate the accumulation in the arteries and red arrows plaques in the surrounding tissue. Examples of manually segmented accumulations are included as well.

