Fig. 2.
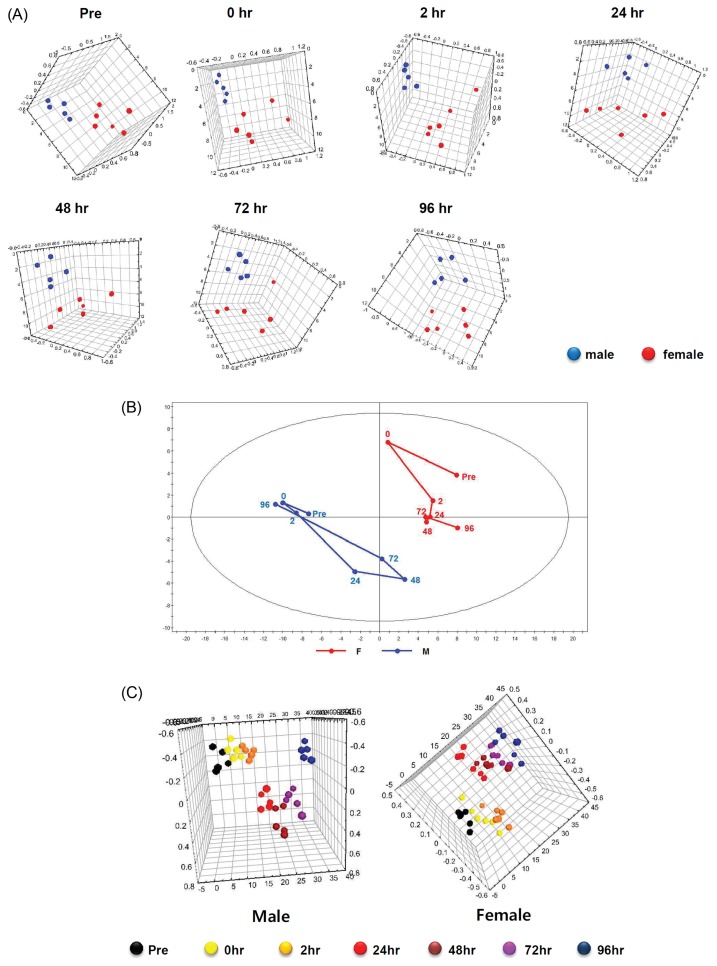
(A) Comparisons of metabolic patterns between male and female subjects according to the elapsed time after the eccentric exercise. Principal Components Analysis (PCA) before the eccentric exercise (Pre) (R2X: 0.653; Q2: 0.0614) and PCA at 0 hr (immediately after the eccentric exercise) (R2X: 0.608; Q2: 0.107), at 2 hr (R2X: 0.61; Q2: −0.0429), 24 hr (R2X: 0.58; Q2: 0.0539), 48 hr (R2X: 0.563; Q2: −0.141), 72 hr (R2X: 0.506; Q2: −0.21), and 96 hr (R2X: 0.665; Q2: 0.188) after the eccentric exercise, compared between males and females, respectively. (B) Trajectory analysis using the principal components analysis (PCA) (R2X: 0.681; Q2: 0.547) based on mean data for 1H NMR of urine samples of the subjects according to elapsed time (at 0, 2, 24, 48, 72, and 96 hr) after the eccentric exercise. (C) The score plots showing that the clustering are completely separated in male (R2X: 0.551; R2Y: 0.191; Q2: −0.0411) and female (R2X: 0.483; R2Y: 0.158; Q2: −0.192) using the Orthogonal Partial Least Square-Discriminant Analysis (OPLS-DA).

