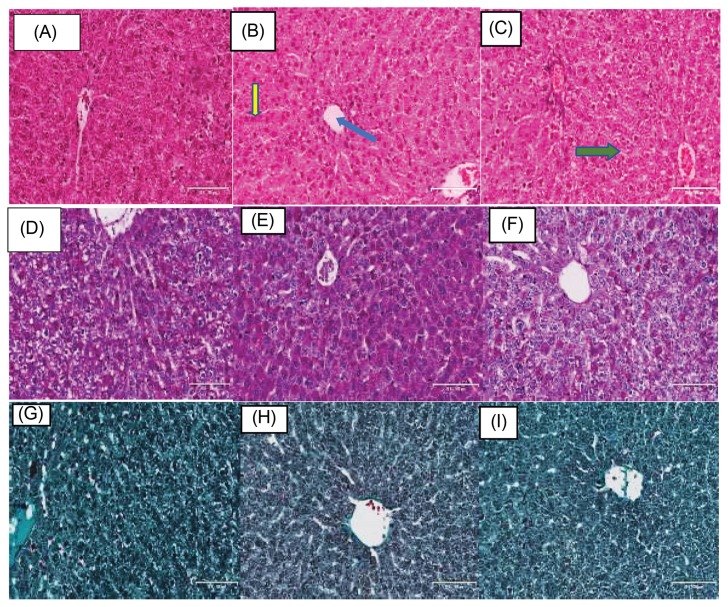
Fig. 2.
Histological and stereological changes in liver. (A–C) Animals stained with H/E, (D–F) PAS, and (G–I) Masson’s trichrome. Green arrow showing hepatocyte plate (Fig. 3B), yellow arrow showing sinusoidal space and blue arrow showing central vein.

