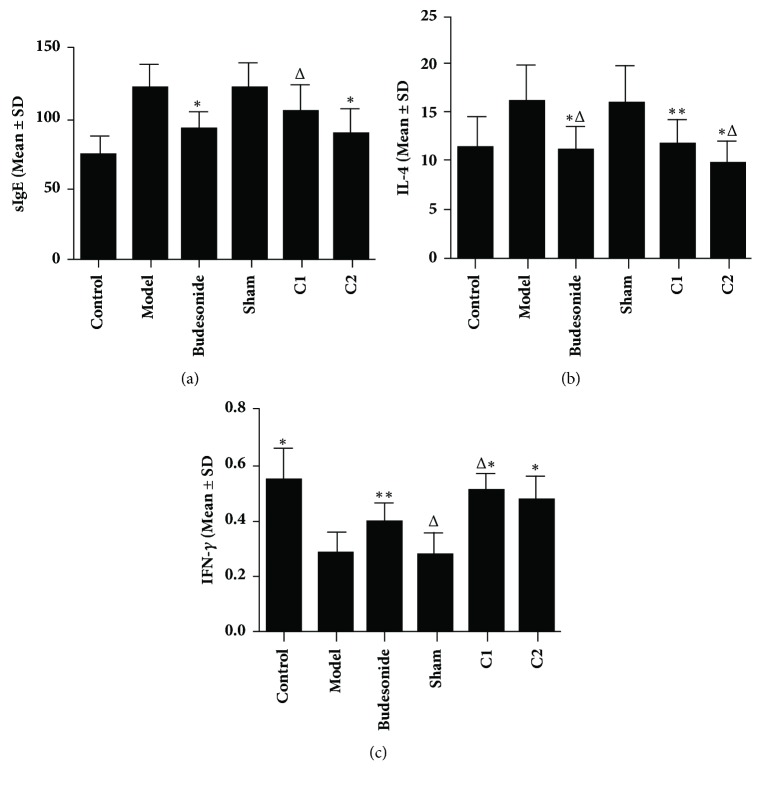
Figure 3.
Effects of CIAA on (a) sIgE, (b) IL-4, and (c) IFN-γ levels. The experimental protocol (essentially the same as in Figure 1) and measurement of the three molecules have been detailed in Materials and Methods. (a) sIgE: ∗P < 0.01 versus the model group; △P < 0.05 versus the model group; C1 versus C2 P > 0.05; Budesonide versus C1/C2, P > 0.05. (b) IL-4: ∗P < 0.01 versus the model group; ∗∗P < 0.05 versus the model group; △P < 0.01 versus the sham group; C1 versus C2, P>0.05; Budesonide versus C1/C2, P > 0.05; (c) IFN-γ: ∗P<0.01 versus the model group; ∗∗P<0.05 versus the model group; △P<0.05 versus the Budesonide group; C1 versus C2, P>0.05; Budesonide versus C2, P>0.05.

