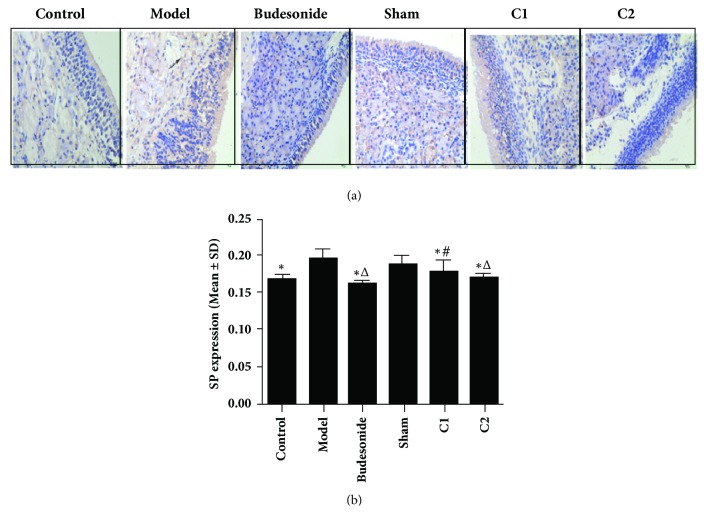
Figure 4.
Effects of CIAA on SP expression. The experimental protocol (essentially the same as in Figure 1) and measurement of SP expression have been detailed in Materials and Methods. (a) IHC image; (b) quantification. ∗P<0.01 versus the model group. △P<0.01 versus the sham group. #P<0.05 versus the C1 group. Scale bar for panel (a) = 50 μm.

