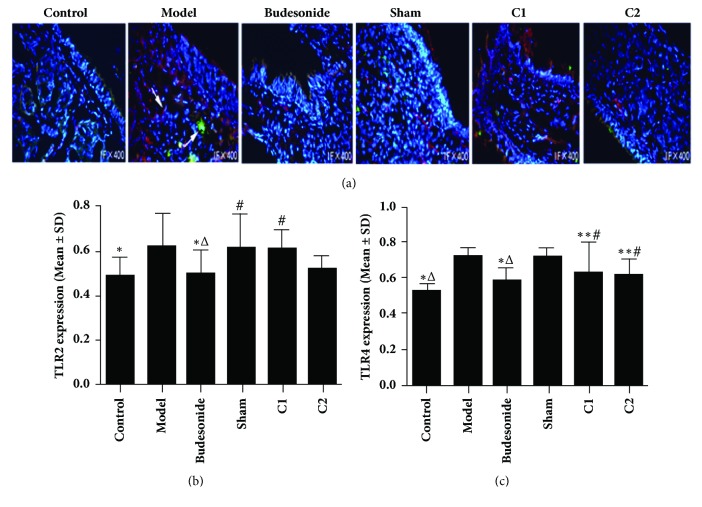
Figure 5.
Effects of CIAA on TLR2 and TLR4 expression. The experimental protocol including fluorescence assays has been described in Materials and Methods. (a) Representative photographs showing TLR2 (green) and TLR4 (red) are shown. Nuclei were stained with DAPI (blue). The data are presented as mean ± SD. (b) TLR2 quantification: ∗P<0.05 versus the model group; △P<0.05 versus the sham group; #P<0.05 versus Budesonide group. (c) TLR4 quantification: ∗P<0.01 versus the model group; ∗∗P<0.05 versus the model group; △P<0.01 versus the sham group; #P < 0.05 versus the sham group.

