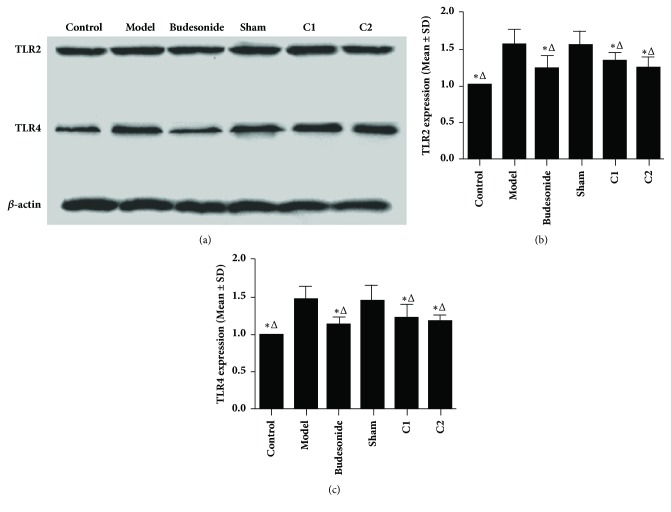
Figure 6.
Effects of CIAA on the cytosolic expression of TLR2 and TLR4. (a) Representative Western blot images showing cytosolic expression of TLR2 and TLR4 in the indicated groups, as described in Materials and Methods. Actin serves as an internal control. (b) TLR2: ∗P < 0.01 versus the model group; △P < 0.01 versus the sham group. (c) TLR4: ∗P < 0.01 versus the model group; △P<0.01 versus the sham group.

