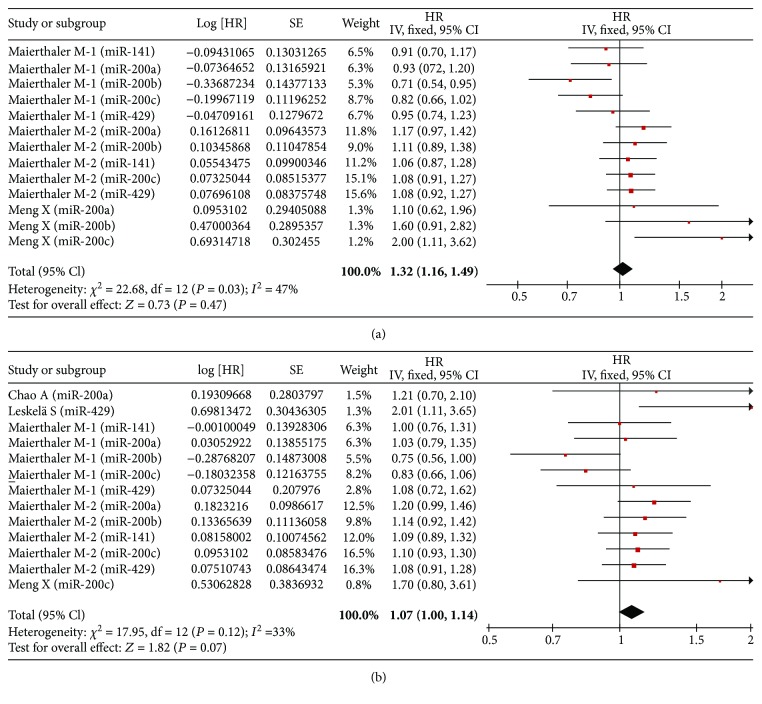
Figure 3.
Forest plot of the association between high expression of the miR-200 family in various tumors and RFS under different types of analysis. (a) Univariate analysis; (b) multivariate analysis. The squares and horizontal lines correspond to the study-specific HR and 95% CI. The area of the squares reflects the weight. The diamond represents the summary HR and 95% CI. CI = confidence interval, HR = hazard ratio.

