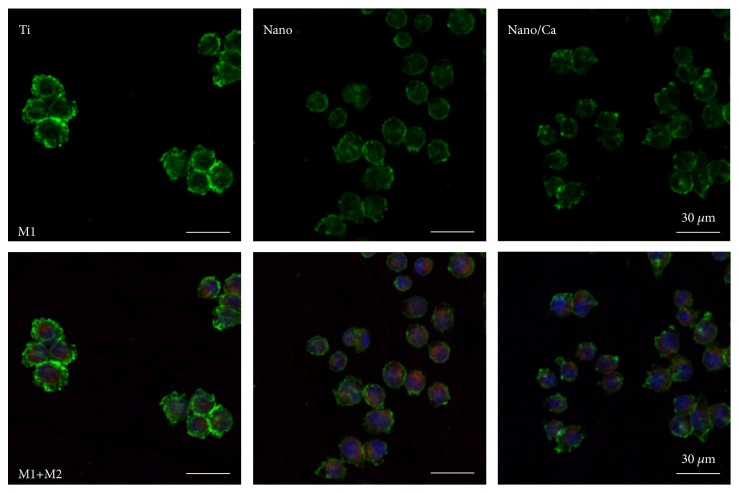
Figure 7.
(upper panel) CLSM images showing expression of the proinflammatory M1 phenotype (CCR7, in green) in macrophages in the investigated samples (lower panel). Merged immunofluorescent images of macrophages expressing proinflammatory M1 and proregenerative M2 phenotypes (CD206, in red) in the investigated samples after 24 h incubation.

