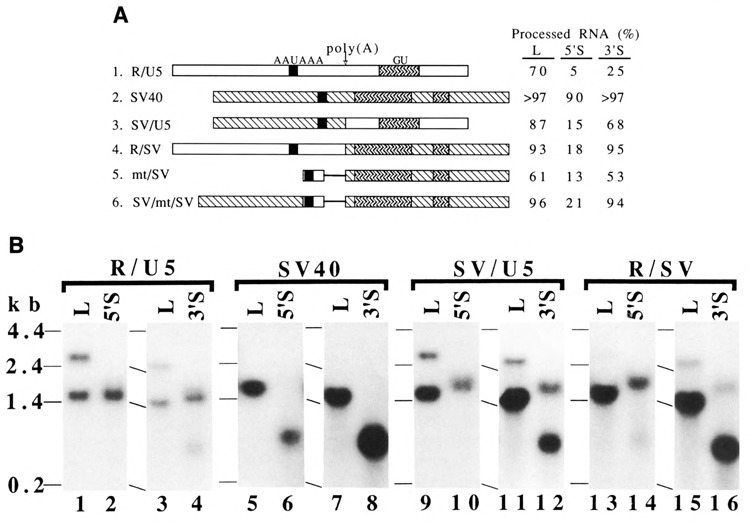
Figure 3.

Chimeric poly(A) signal sequences to test distance-dependent RNA 3′ end formation. A. Structures of chimeric poly(A) signals and the efficiency of RNA 3′ end formation at the poly(A) sites. The R/U5 region and the SV40 late poly(A) signal sequences are shown by  and
and  , respectively. The downstream elements of SV40 shown in this figure were defined by others (Conway and Wickens, 1985; Sadofsky et al., 1985). Variation was the largest, 61% ± 13 (mean ± s.d.), for R/SV; and the smallest, 93% ± 2, for R/SV. When the level of total RNA from the L construct was taken as 1.0 in each set, the relative levels of total RNA for other constructs were as follows: R/U5 (L: 5′S: 3′S = 1: 0.9 :1.2), SV40 (L: 5′S; 3′S = 1: 0.3 :1.4), SV/U5 (L: 5′S: 3′S = 1: 0.6 :0.4), R/SV (L: 5′S: 3′S = 1: 0.4 :1.1), mt/SV (L: 5′S: 3′S = 1: 0.8 :0.8), and SV/mt/SV (L: 5′S: 3′S = 1: 1: 0.6). See the legend of Figure 2A for other symbols. B. Northern blot analyses. D17 cells were transfected with the indicated constructs. See the legend of Figure 2B for for other descriptions.
