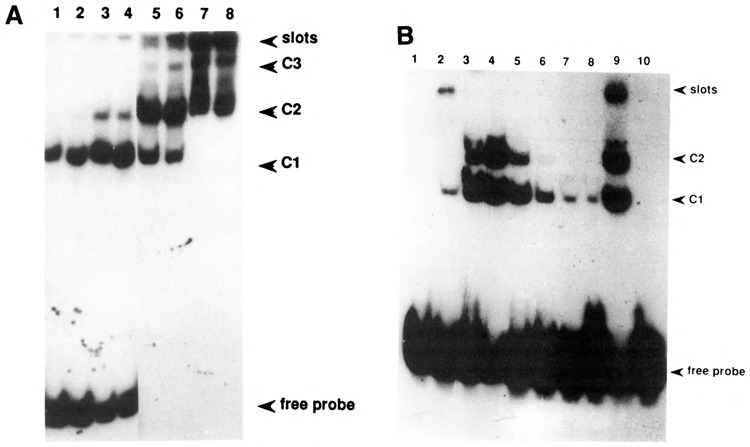
Figure 4.

Bandshift analysis of the −104 to −71 oligomer. A. Lanes 1, 3, 5, and 7: 1.2, 2, 3.5, and 10 μg, respectively, of crude control extract; lanes 2, 4, 6, and 8: 1.2, 2, 3.5, and 10 μg, respectively of crude PB-induced extract. B. Crude nuclear PB-extract was chromatographed on a superose 12HR column (Pharmacia; result not shown), and consecutive fractions were then used for a band shift analysis of the oligomer. Numbers 1–8 correspond to these consecutive fractions, of which 15 μl were used in a total assay volume of 30 μl; lane 9: crude PB-extract; lane 10: free probe.
