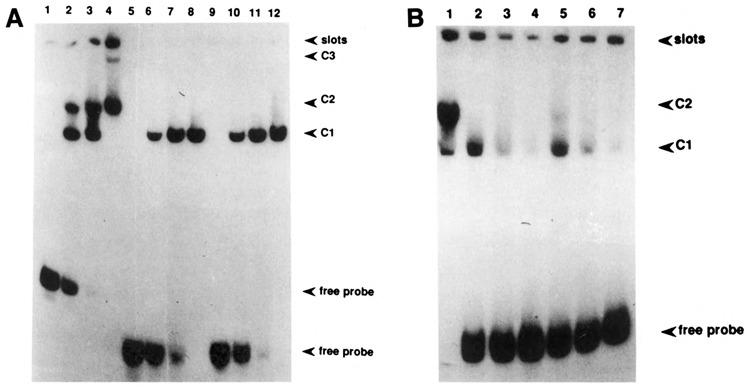
Figure 6.

Band shift analysis of the CYP2B2-oligomers indicated in Figure 5. A. Increasing protein concentrations were used: 0, 2.5, 5, and 10 μg of crude control extract for lanes 1–4, 5–8, and 9–12. Lanes 1–4: using the −104 to −71 (c-myc) oligomer as a probe; lanes 5–8: using the BTE-oligomer as a probe; and lanes 9–12: using the B. megaterium oligomer as a probe. B. Competition experiment: the −104 to −71 oligomer was used as a probe for a band shift analysis using 5 μg of crude control extract (lane 1). Lanes 2, 3, and 4: competition with 10, 20, and 50×, respectively, molar excess of BTE oligomer; lanes 5, 6, and 7: competition with 10, 20, and 50×, respectively, molar excess of the B. megaterium oligomer.
