Figure 2.

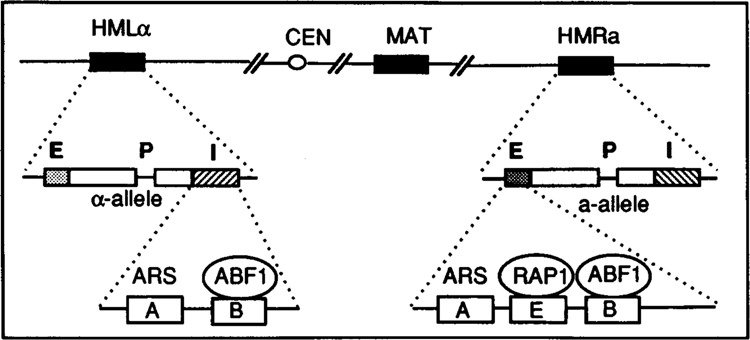
Schematic representation of mating-type elements on Chromosome III (not drawn to scale). E and I (in bold) indicate the silencer regions flanking the silent loci. P represents the promoter in the silent loci.

Schematic representation of mating-type elements on Chromosome III (not drawn to scale). E and I (in bold) indicate the silencer regions flanking the silent loci. P represents the promoter in the silent loci.