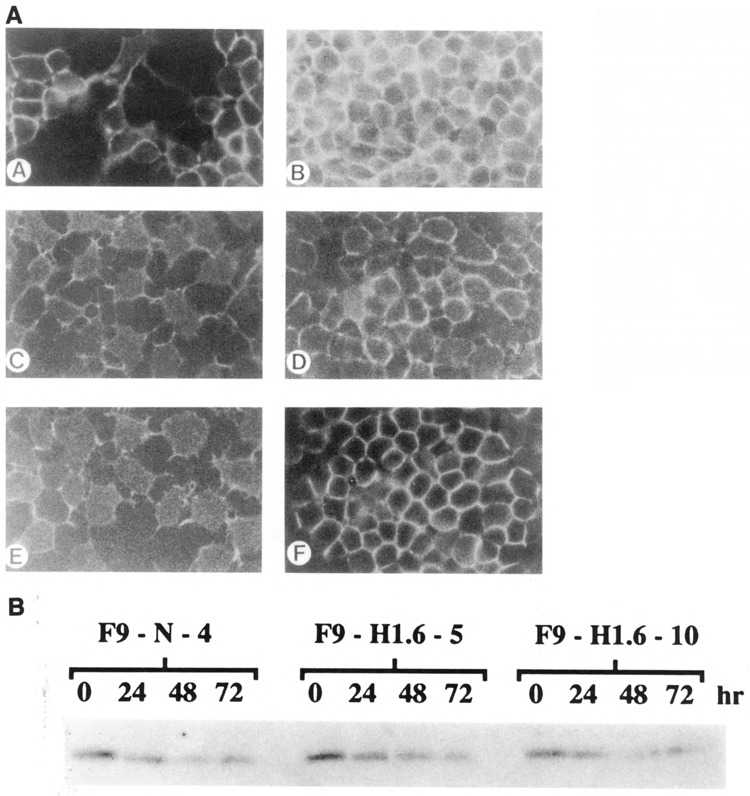
Figure 8.

Expression and localization of E-cadhherin. A. E cadherin expression and localization were detected by immunofluorescent staining of F9-N-4 (A, B), F9-H1.6-5 (C, D), and F9-H1.6-10 (E, F) stem cells growing at either low (A, C, E) or high (B, D, F) cell densities, as described in the text. Two-second exposures are shown for all cells. B. A Western analysis of E-cadherin is shown. Control and pMT-993S-transfected cells were grown in the presence of 100 μM ZnCl2 for indicated times. 500 μg of total cell protein were used per lane. Protein was visualized with 125I-labeled Protein A; autoradiographs were exposed for five days.
