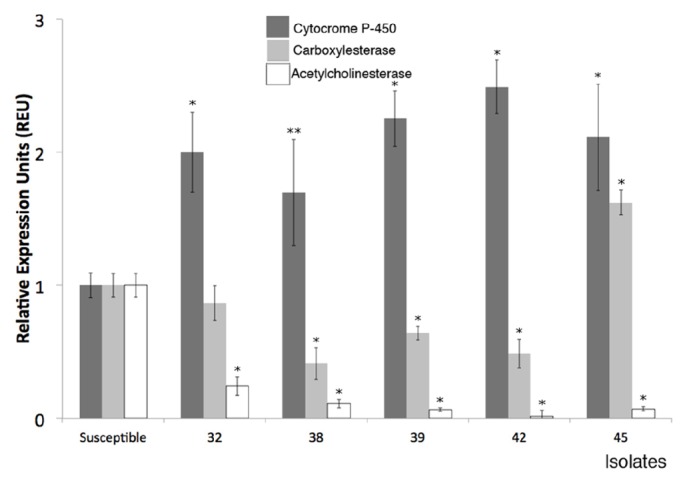
Figure 1.

Cytochrome P-450 (CYP), carboxylesterase (CE), and acetylcholinesterase (AChE) gene expression by real-time PCR in acaricide-susceptible ticks and field isolates. The black bars represent the CYP data, the gray bars represent the CE data, and the clear bars represent the AChE data. The data are represented as relative expression units (REU) compared to the susceptible reference strain. The means and SD are shown. ∗ Statistically significant difference (P<0.01) compared to Su reference strain. ∗∗ Statistically significant difference (P<0.05) compared to Su reference strain.
