Figure 2.

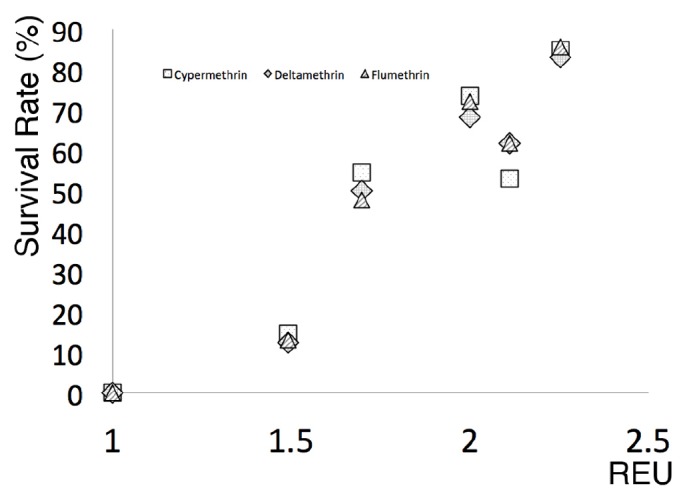
Linear regression analysis of acaricide-susceptible ticks and field isolates. The X axis represents the CYP expression in REUs and the Y axis represents the tick survival rate under different Pyr acaricide formulations; R of 0.85 (P<0.05).

Linear regression analysis of acaricide-susceptible ticks and field isolates. The X axis represents the CYP expression in REUs and the Y axis represents the tick survival rate under different Pyr acaricide formulations; R of 0.85 (P<0.05).