
Figure 4.
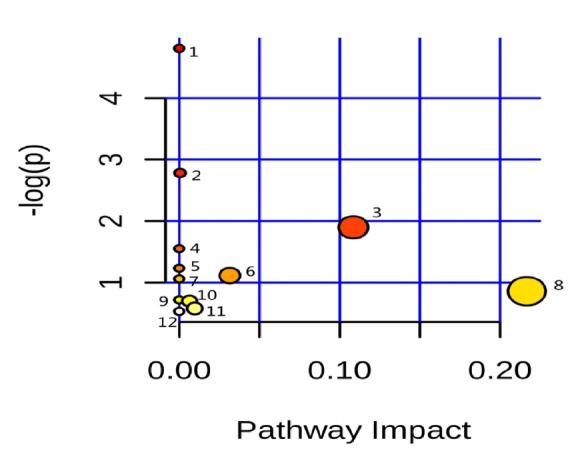
Differential metabolite related pathway. Note that numbers 1-12 represent different metabolic pathways, the name of metabolic pathways, and distribution parameters as shown in Table 10.
Official websites use .gov
A
.gov website belongs to an official
government organization in the United States.
Secure .gov websites use HTTPS
A lock (
) or https:// means you've safely
connected to the .gov website. Share sensitive
information only on official, secure websites.
Differential metabolite related pathway. Note that numbers 1-12 represent different metabolic pathways, the name of metabolic pathways, and distribution parameters as shown in Table 10.